
Disability Profile - Monaghan
Issued on October 11 2018
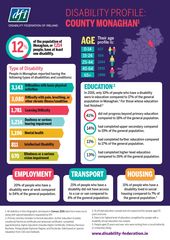
Disability Profile: Monaghan[1]
Population
12% of the population of Monaghan or 7,214 people have at least one disability.
Age
Their age profile is:
0-14 637
15 – 24 454
25 – 44 1244
45 – 64 1993
65+ 2886
Type of Disability
People in Monaghan reported having the following types of disabilities and conditions:
Difficulties with basic physical activities | 3,143 |
A difficulty with pain, breathing, or any other chronic illness or condition | 3,080 |
Learning difficulty | 1,781 |
Deafness or serious hearing impairment | 1,214 |
Mental health | 1,196 |
Intellectual disability | 811 |
Blindness or a serious vision impairment | 670 |
Education[2]
In 2016, only 10% of people who have a disability were in education compared to 17% of the general population in Monaghan.[3] For those whose education had finished:[4]
- 41% did not progress beyond primary education compared to 18% of the general population.
- Only 14% had completed upper secondary compared to 19% of the general population.
- Only 11% had completed further education compared to 17% of the general population.
- Only 13% had completed higher level education compared to 26% of the general population.
Employment
- 20% of people who have a disability were at work compared to 54% of the general population.
Transport
- 21% of people who have a disability did not have access to a car or van compared to 8% of the general population.
Housing
- 11% of people who have a disability lived in social housing compared to 7% of the general population.[5]
[1] All statistics in this infographic are based on Census 2016 data from www.cso.ie.
[2] Primary and less includes no formal education, further education includes vocational/technical certificate and advanced certificate/ completed apprenticeship, higher education includes Higher Certificate, Ordinary/Honours Bachelor, Postgraduate Diploma/Degree, and Doctorate. Data based on special tabulation from CSO and Statbank.
[3] % of total education ceased and not ceased and for people aged 15 years and over.
[4] Data is for highest level of education completed for people with a disability whose education has ceased.
[5] People aged 15 years and over, who were renting from a Local Authority or a Voluntary Body.